This post isn't meant as an exhaustive manual for DDD. Instead I'll show you some basic usage and some tips. I will also describe some of the quirks of DDD, that should not discourage people from using this extremely powerful debugger, in all of it's Motif glory.
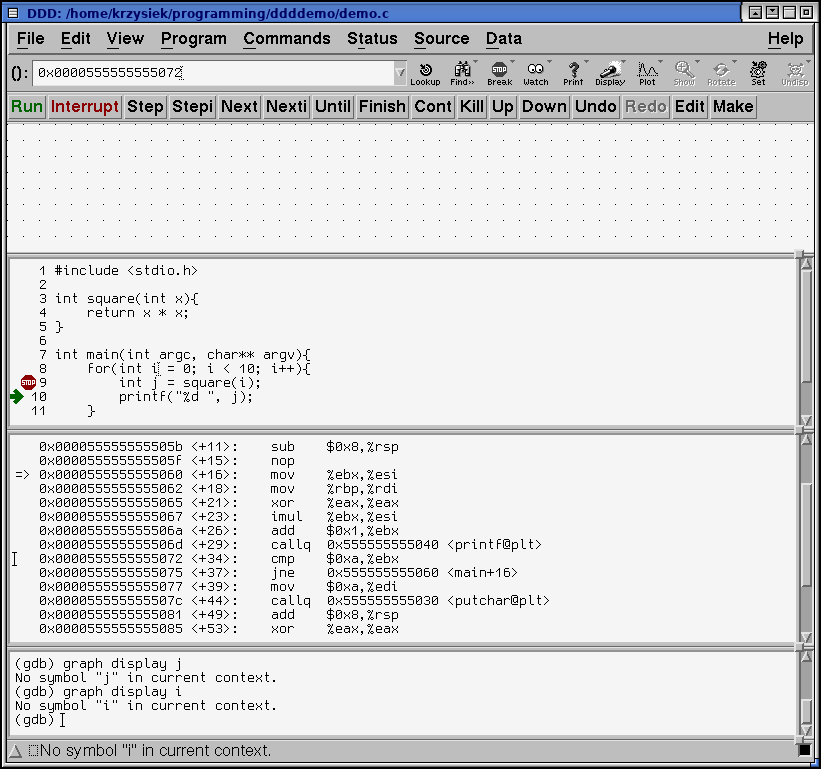
When you start DDD, you should see something like this:
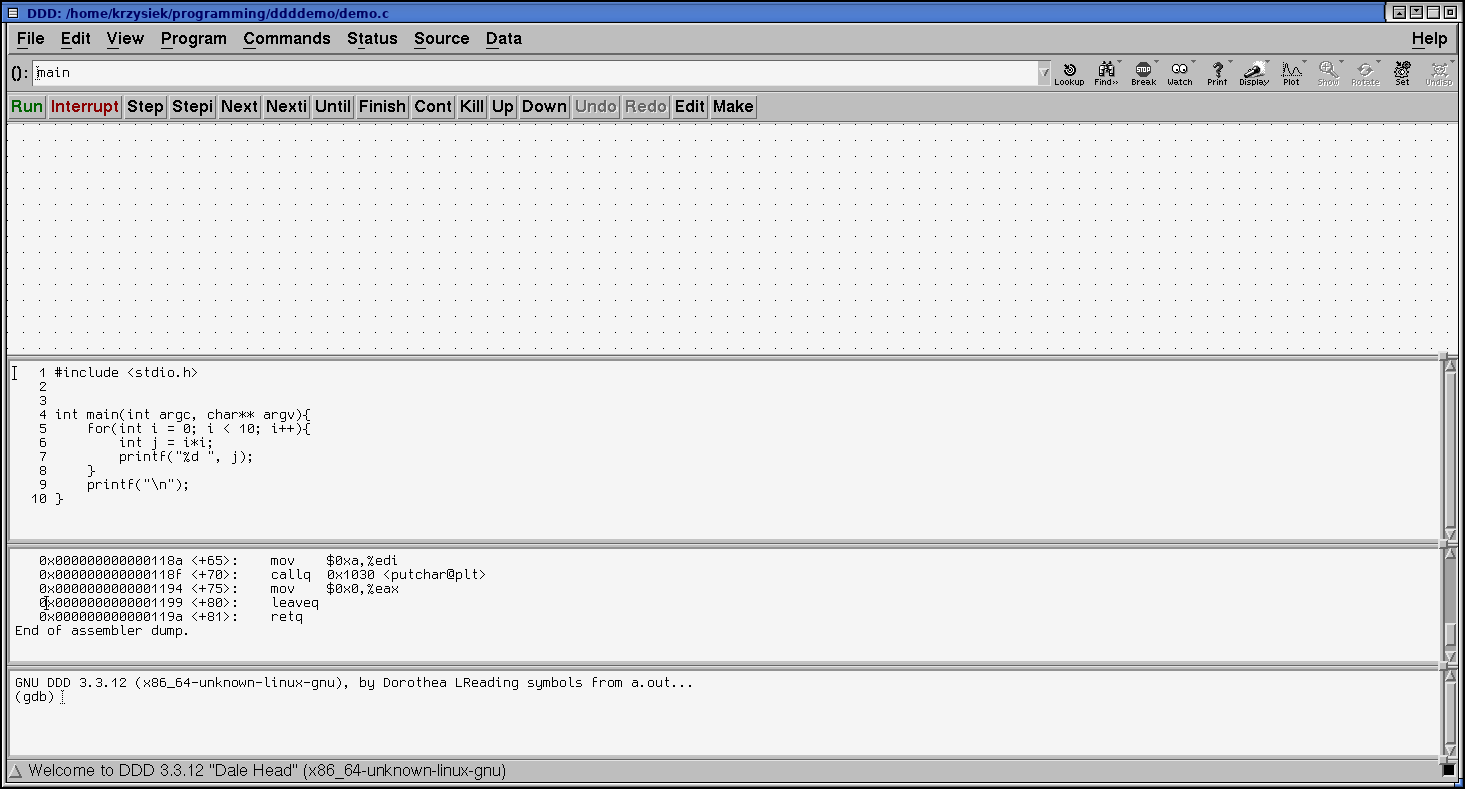
The DDD window is divided into 4 panes:
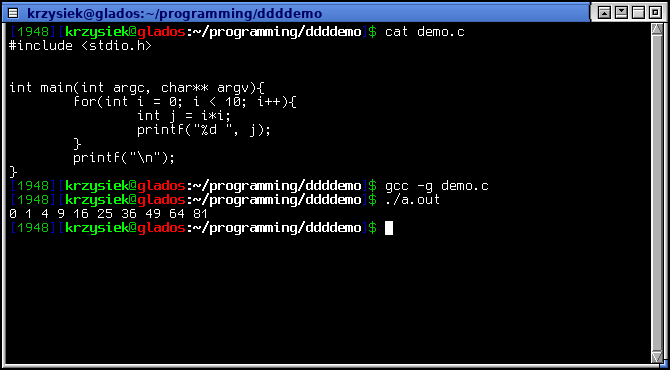
Before we start using DDD, we need a program to debug and play with. Below is an example that I will be using throughout this post:
#include <stdio.h>


int main(int argc, char** argv){
	for(int i = 0; i < 10; i++){
		int j = i*i;
		printf("%d ", j);
	}
	printf("\n");
}
Make sure to compile it with -g to include the debug symbols:
gcc -g demo.c
Now, run the debugger with
ddd a.out
Note: you canot specify arguments on the command line. If you need to set them, use the GDB console in DDD: set args foo bar baz
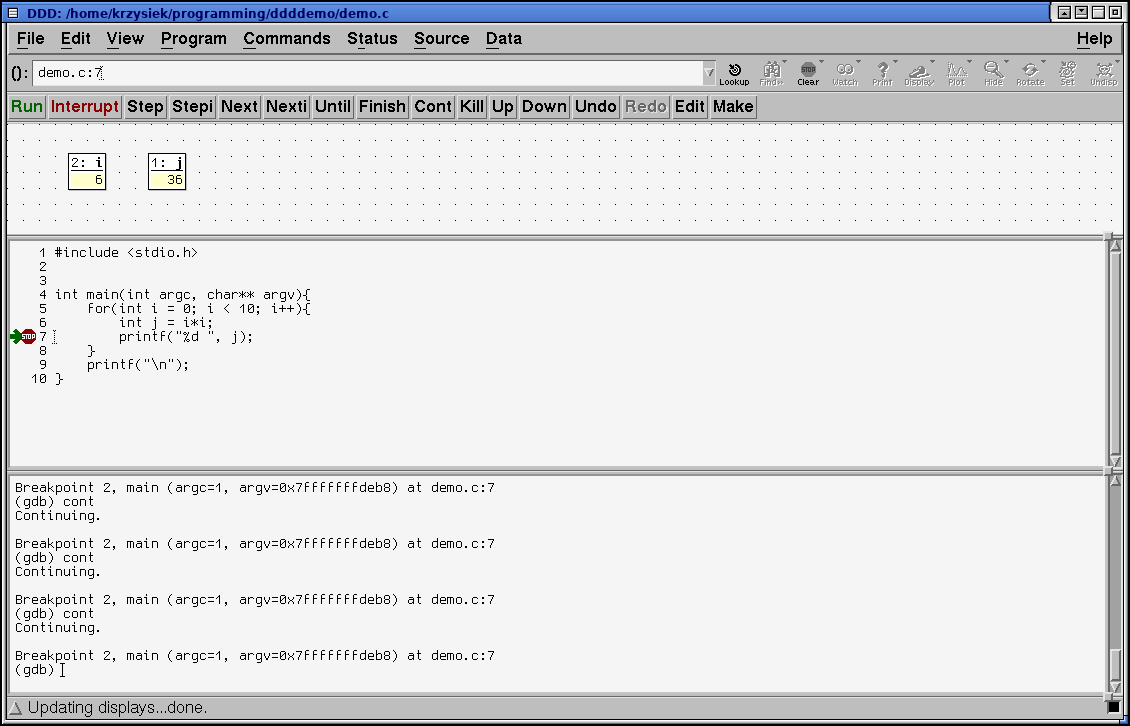
I like to have the output appear in a separate xterm, so that it doesn't clog up the gdb prompt. To do this, tick Program > Run in Execution Window from the menu. I also have line numbers enabled (Edit > Preferences > Source > Display Source Line Numbers)
To set a breakpoint, double click to the left of the source line in the source window. A red STOP icon will appear next to it. Click Run to start execution. The green arrow that shows the current position will appear as soon as you hit the breakpoint. The buttons above the Data window behave just like the aproppriate GDB commands.
You can disable or edit the breakpoint properties by double clicking on the STOP symbol
While the program is running, you can click on a variable name to bring it up in a display in the data window (as seen above). These displays will update every time the program hits a breakpoint.
Note: If you try to bring a variable up while the program is not running, or a variable from a different context, you will get a No symbol xyz in curent context error. First you set the breakpoints, then you bring the displays up. The displays show up only if the corresponding variables are in the current scope, just like in regular gdb
DDD can be used to peek at memory contents at any address. To do so, click Data > Memory. The following window will pop up:
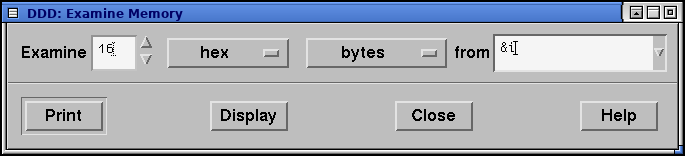
You can enter any valid C expression into the From text field. Select appropriate values and click Display to bring it up in the Data window, or Print to dump it in the GDB console
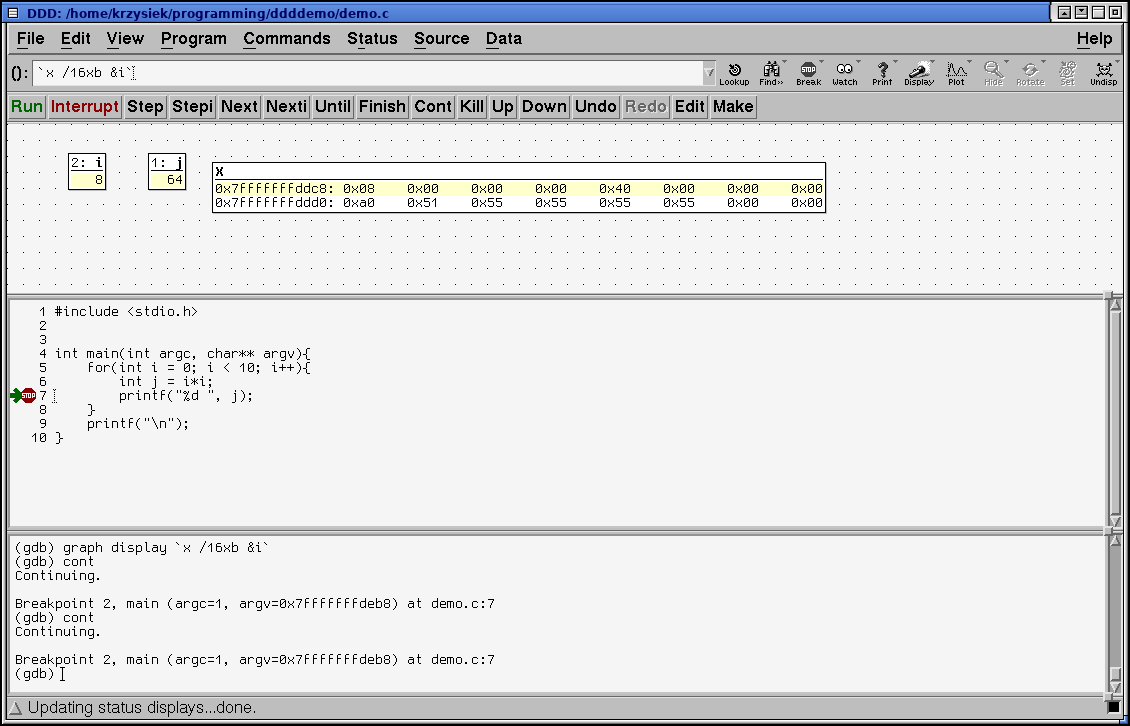
In the above example you can see the value of i, 0x00000008 at 0x7fffffffddc8 (top left of the display window) and the value of j, 0x00000040 at 0x7fffffffddcc (middle left 0x40 and the following 0x00-s)
But what if I want to look at the memory before a variable? Very simple with some pointer arithmetics:
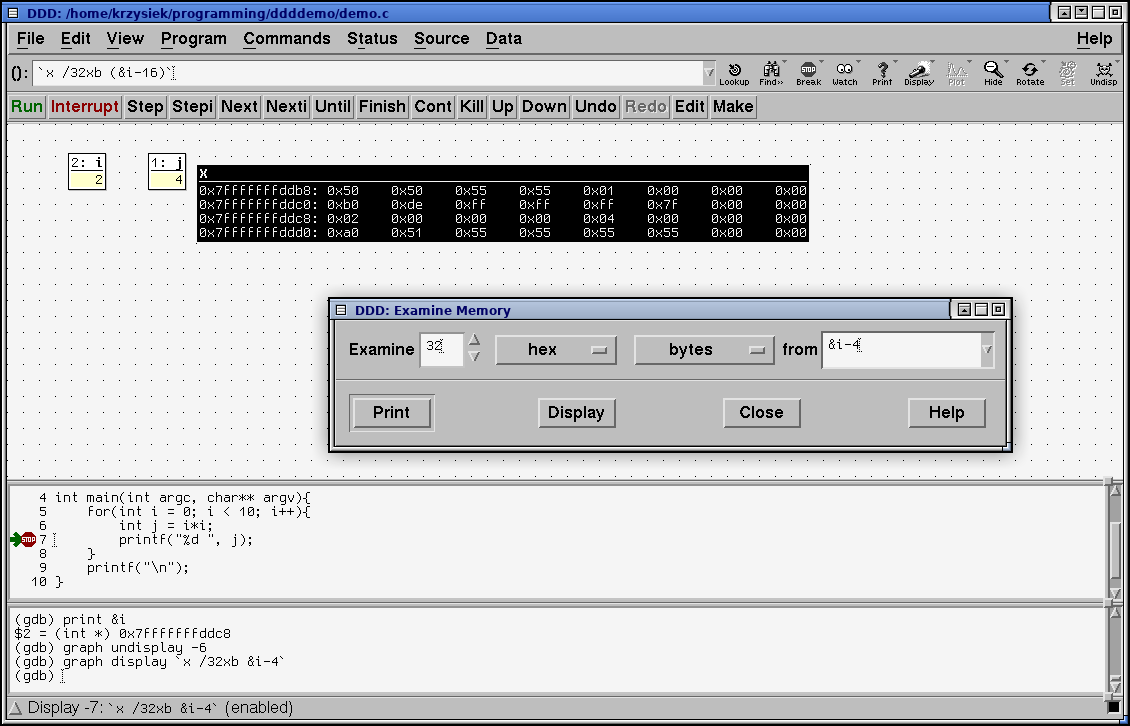
This expression takes the address of i and takes away 4*sizeof(int) = 16 bytes. I want to display 32 bytes, so that the value of i will be in the middle of the dump. It's useful sometimes. You can see that I have typed
print &i
to peek at what address i is at.
gdb respects C pointer arithmetics, so if you add, or substract X, you need to keep in mind that you are adding and substracting X*sizeof bytes.
Note that there is a bug in the Memory window, and if you bring it up for the second time, the value of from field will be incorrect. You have to corect it manually
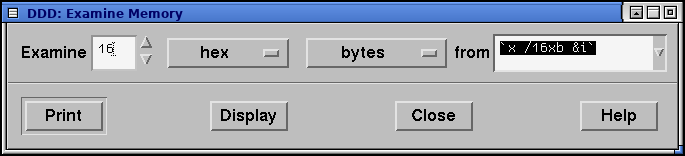
This is one of the DDD quirks... but hey! The copyright date is 2009 - it is a bit forgotten but that does not make it any less useful. You just have to keep that in mind when using it.
You can look up several words of memory beginning with the value of the stack pointer:
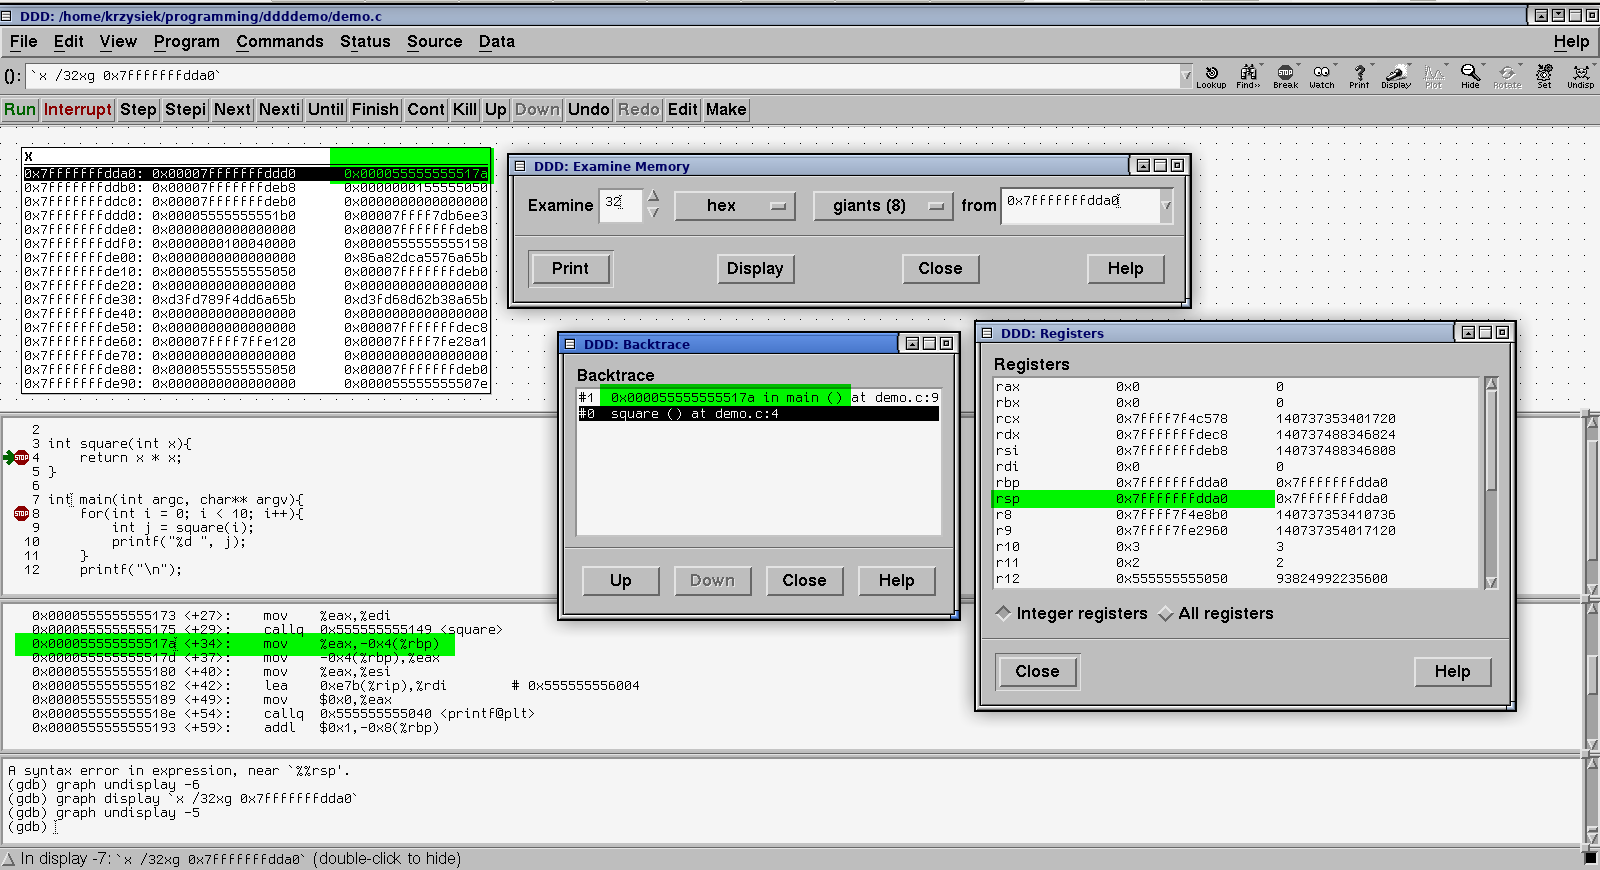
Let's stop here for a second, because there is a lot going on in that image. First of all I have added a small function - it's hard to show how stack works if your program is only a single function.
Then you can see the Examine Memory window, which is set to display 32 quadwords (called giants) after the address 0x7fffffffdda0.
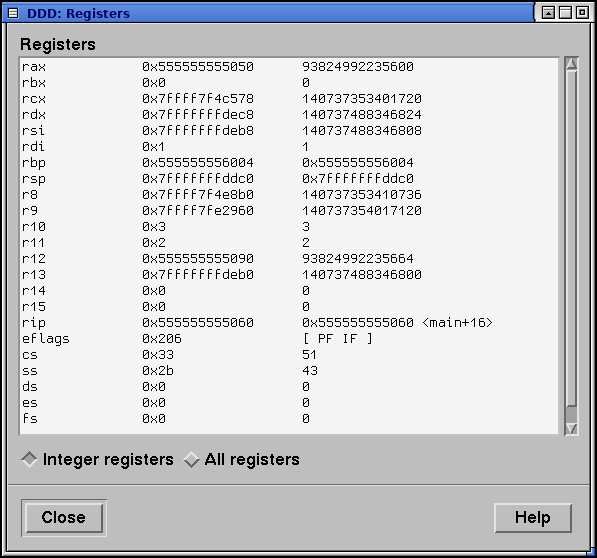
Then, I have brought up the backtrace and the register window from the Status menu.
In that window, you can see that the address 0x7fffffffdda0 is the value of the stack pointer register in the register window
You can see the return address in memory on the stack (marked green in the hexdump). It points to the mov just after the square() call (see the disassembly, marked)
Note: you can bring up any function source and/or disassembly if you type it into the (): text field on top of the window
In this example, the program is stopped with a breakpoint, and at this moment, i = 4. We will edit the value of i, set it back to 0, and continue execution of the program.
Once you have a variable in the data window, you can right click on it and select Set Value to change it.
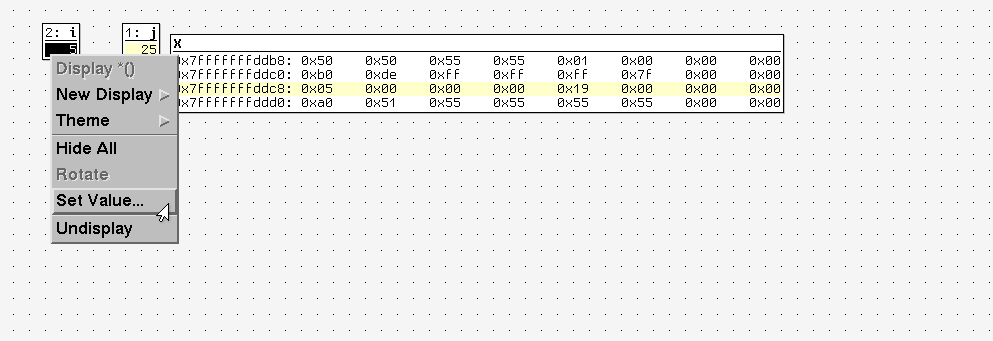
A window will pop up where you can enter the new value.
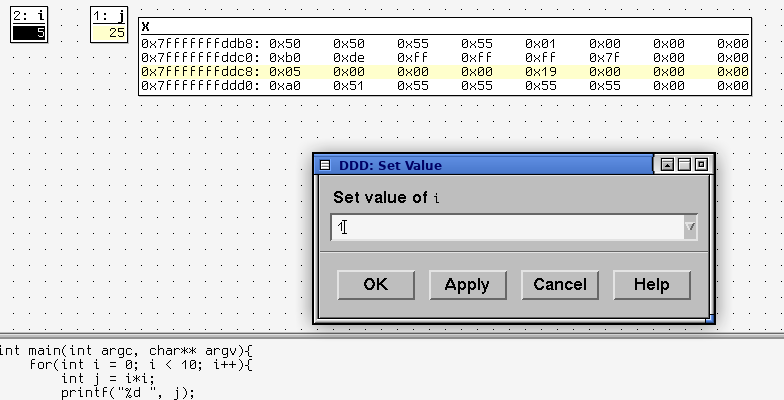
Click OK. Then double click on the STOP symbol to open the breakpoint properties window and disable it
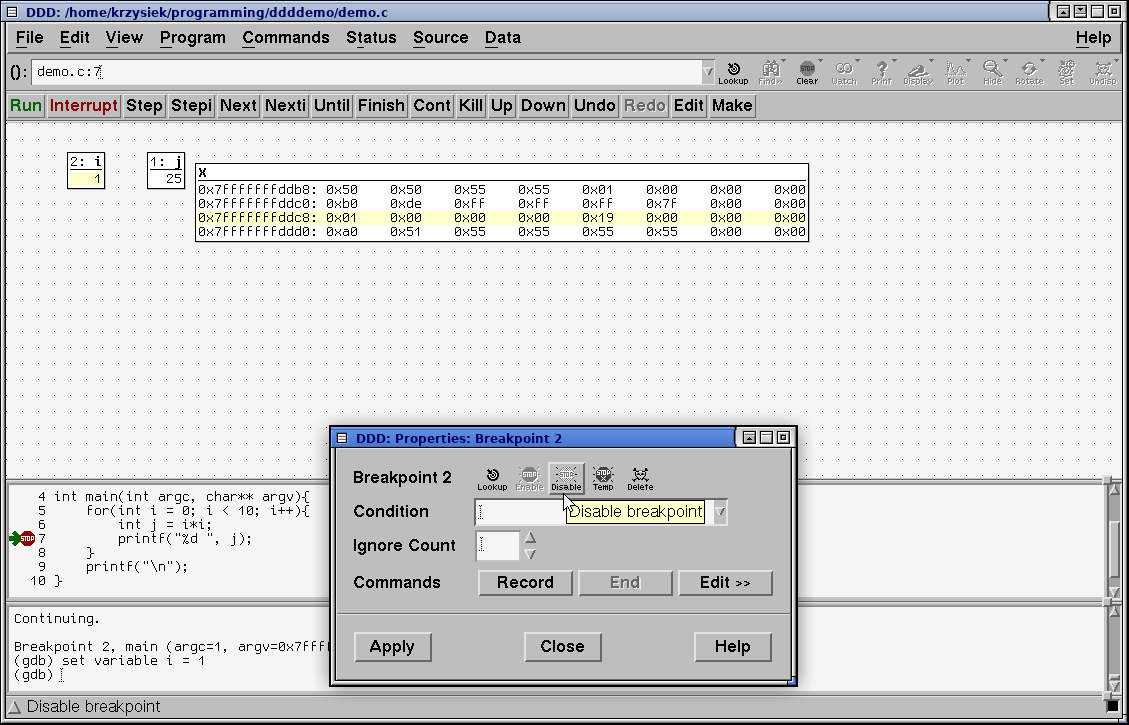
Then click continue. You can see that the program's behavior has changed as we modified the value of i
Unfortuantely this doesn't work with hexdumps nor registers. You have to use the gdb prompt for that.
(gdb) set variable *(0xffffd040) = 0x1badc0de
(gdb) x/8w 0xffffd040
0xffffd040:   0x1badc0de   0x00000001   0x56559000   0xffffd114
0xffffd050:   0x00000001   0xffffd114   0xffffd11c   0x5655629d

(gdb) set variable $eip = 0x00000000
(gdb) print $eip
$3 = (void (*)()) 0x0
Note that changing the above eip value like that will rather not make the program happy.
Quite often you have to deal with optimized code, whether that's MCU development or regular programming.
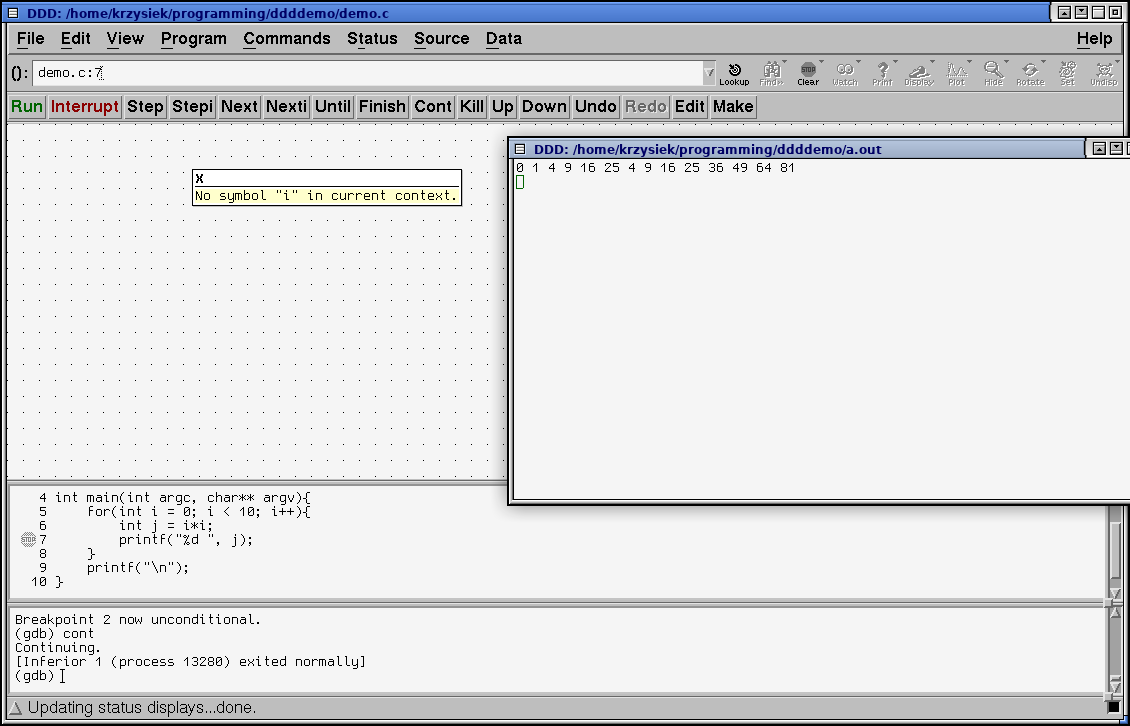
Let's recompile the program with -O3 to force maximum optimization. This will cause less unnecesary writes to and reads from the memory, as well as less register shuffling. Open it in DDD, set a breakpoint, click Run, and try to peek at a variable...
...but what's that? No symbol "i" in current context? It's clearly there!
Let's take a closer look at what the compiler has come up with in the disassembly window.
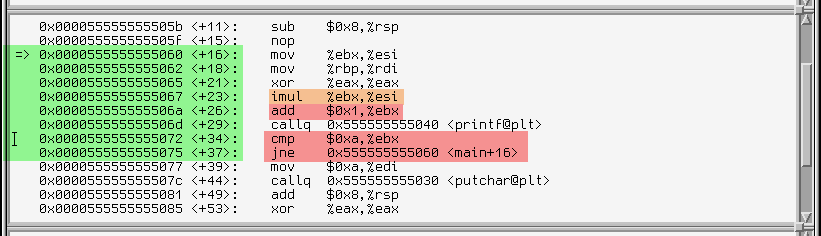
-O3 made the code heavily optimized, but we can make out the loop body (marked green), and the multiplication operation (orange).
We can also see that ebx is the loop counter, looking at the operations it's used for. First it's incremented (at +26), then compared with a value of 10 (0xa, at +34) and the code jumps back to +16 if it's not equal (jne instruction at +37)
There is also another register at play - esi. First, the mov (not highlighted, at +16) copies the value of ebx to esi, then the imul (orange) multiplies ebx with esi and puts the result back in esi [1] (esi now contains the square of ebx).
Our compiler put some work into making it all work fast. The esi register carries the second argument for the next printf call (as specified in the SysV calling convention for x86_64 [2]). The optimizer removed unnecesary memory writes and register shuffling by cleverly putting the variables in registers.
In this case the compiler put the variable i in register ebx, and j in register esi
They aren't stored in RAM at all anymore - but we can still examine them while the program is running.
Let's put some breakpoints in the assembly. One at the very beginning should suffice. Double click left of the assembly line in the listing. Note that the STOP icon will appear somehwere in the source window
We can now peek at the reigster values. Here's another quirk of DDD - double clicking the register name doesn't work in machine code window. Instead, you can do two things:
The first one is easy. I have shown it previously.
However, DDD has another powerful feature: You can display the output of any gdb command in the display window!
You just have to enclose the gdb expression in backticks (`)
You can bring up a new display from the GDB command line with the graph display `expr` command...
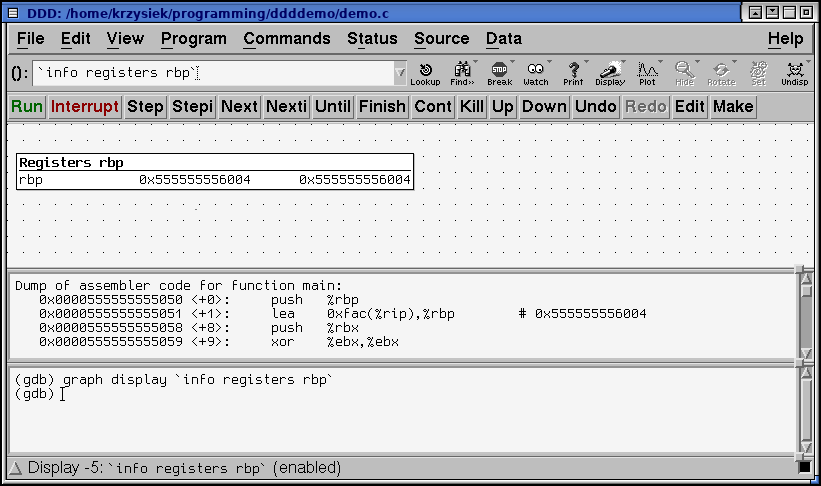
...or do it with the GUI: right click in the data window and select New display
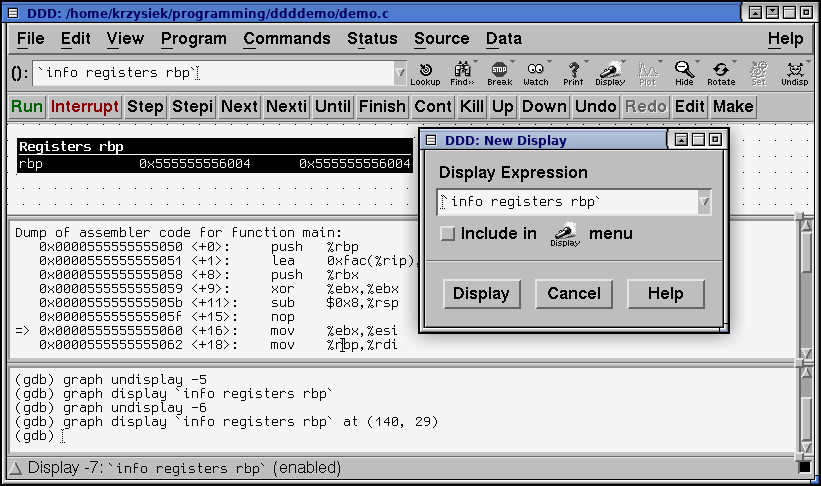
Below another example. Those display will dynamically update as breakpoints are hit
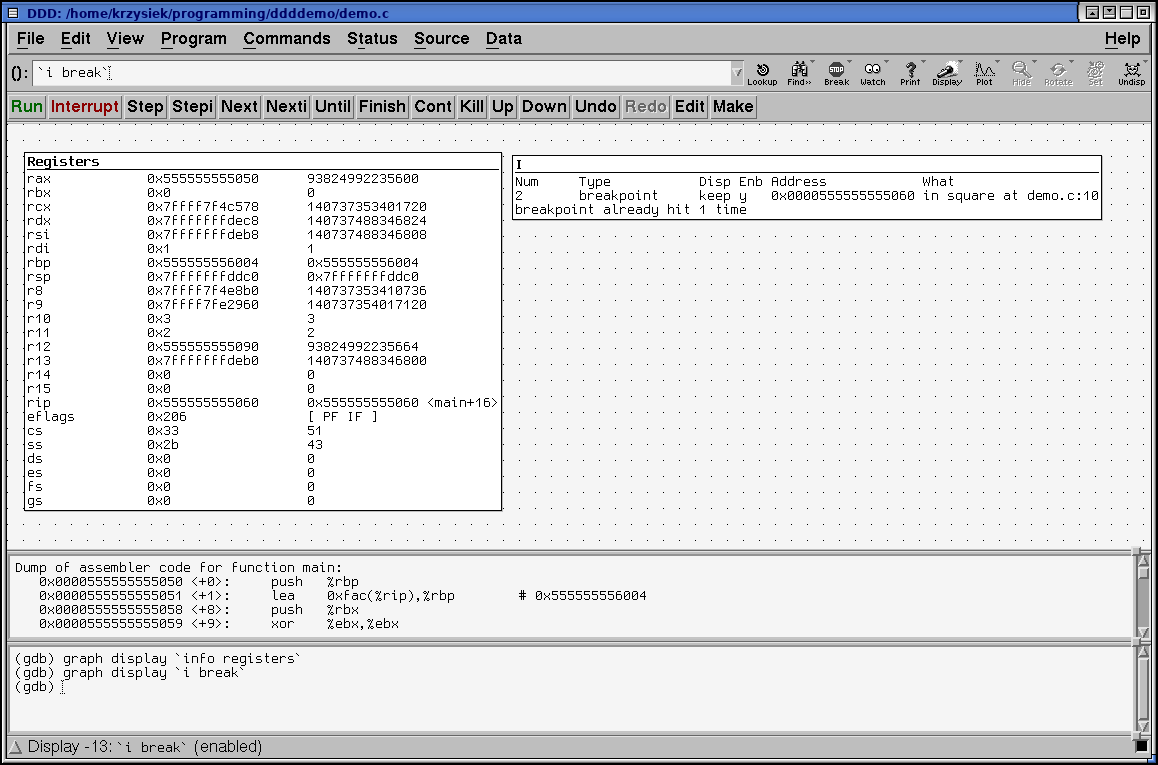
I hope this post has shown you enough of the cool tool that DDD is to play with it yourself. While it's quirky at times, I find it very useful for when the TUI of gdb doesn't suffice. While most IDEs have their own debuggers (which, in most cases, are gdb frontends too), DDD is a standalone program and it's a good choice if you are programming using a text editor and a terminal.
^ 1 - ATT syntax uses different operand order than intel. If you don't like this syntax, you can change it the usual GDB way (set disassembly-flavor intel ) or select Edit > GDB Settings > Disassembly flavor (you have to scroll down past the tickbox options)
^ 2 - The SysV caling convention for x86_64 passes integer or pointer arguments in these registers: rdi, rsi, rdx, rcx, r8, r9, and the rest on the stack. In case of older x86 (32-bit) calling convention, we would have to be looking at the stack, as all the arguments are passed via the stack in that convention.